


Understanding the Shape of Your Data
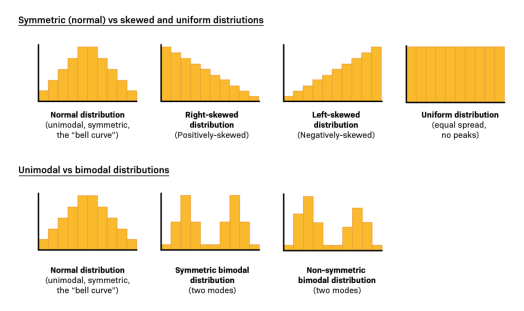
Histograms help identify the shape of the distribution, which directly informs how you analyze and improve a process:
1) Normal Distribution (Bell Curve)
- Symmetric around the mean
- Most values cluster in the middle
- Many statistical tools assume normality
2) Skewed Distribution
- Right-skewed: long tail to the right (e.g., response times with a few very long delays)
- Left-skewed: long tail to the left
3) Bimodal or Multimodal
- Two or more peaks
- Often indicates multiple process streams or conditions
- Example: two different teams handling tickets differently

Real-World Example: IT Support Ticket Response Time
Consider an IT support system tracking time to first response for tickets. A histogram shows:
- Highest frequency in the 2–3 hour range
- A longer tail to the right(some tickets take much longer)
- A second smaller peak at 13–14 hours
If you only looked at the mean and standard deviation, you might miss that there are two peaks, indicating two different behaviors—perhaps:
- Tickets handled by different shifts
- Complex tickets routed to a specialized queue
- System downtime during certain hours
Histograms surface these insights immediately and guide root cause analysis.

How to Create a Histogram (Step-by-Step)
- Collect continuous data
Ensure consistent measurement definitions. - Choose bin width
Too few bins hide patterns; too many create noise. - Plot frequencies
Count how many observations fall in each bin. - Review the shape
Look for center, spread, skewness, and peaks. - Overlay targets or specs (optional)
Helps compare performance vs expectations.
Common Mistakes When Using Histograms
- Using histograms for categoricaldata
- Choosing inappropriate bin sizes
- Interpreting a single histogram without context
- Ignoring multi-modal patterns
- Treating histogram results as final answers (they are diagnostic, not conclusive

How ICEQBS Teaches Histograms (Beyond Theory)
Many programs explain histograms in isolation. ICEQBS focuses on application in real projects:
- Learners build histograms using their own workplace data
- Trainers help interpret shapes and link them to process causes
- Histograms are used alongside Pareto, Fishbone, and hypothesis testing
- Teams learn to move from “pretty charts” to actionable insights
This practical approach ensures professionals don’t just draw histograms—they use them to improve performance.
Final Takeaway: If You Can See Your Data, You Can Improve Your Process
Histograms turn raw numbers into clear stories about how a process behaves. They reveal patterns, variation, and hidden problems that averages alone cannot show. In Six Sigma, histograms are often the first step from opinion to evidence—and from evidence to improvement.
If your team is serious about data-driven excellence, mastering histograms is not optional—it’s foundational.