
+971 56 594 5906

contact@iceqbs.org

Instagram Facebook-f Linkedin Youtube
  • About Us
  • Our Courses
    • Yellow Belt
    • Green Belt
    • Black Belt
    • PMP
    • Lean Practitioner
  • Combo Courses
    • Green Belt + Black Belt
    • PMP + Black Belt
    • PMP + Green Belt + Black Belt
    • Lean Practitioner + Green Belt + Black Belt
  • Corporate Training
    • Corporate Six Sigma Training
    • PMP Corporate Training
    • Customized Corporate Training
  • Consulting
    • Lean Six Sigma Consulting
    • Process Improvement
    • Quality Consulting
  • Insights
    • Blogs
    • Case studies
  • Testimonials
Contact Us
css-bg-remove.png
pmi bg remove

Histogram in Six Sigma: A Practical Guide to Understanding Process Behavior and Data Distribution – Part 1

  • October 9, 2026
  • admin

In process improvement, the most dangerous phrase is:

“The average looks fine.”

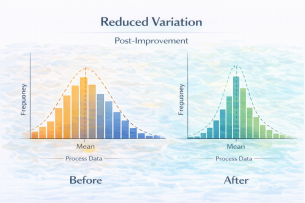
Averages hide problems. Two processes can have the same mean and standard deviation, yet behave completely differently. This is why quality professionals rely on visual tools—and among the 7 QC tools, the Histogram is one of the most powerful for making data behavior visible.

A histogram does not just summarize numbers; it reveals the shape of reality. It helps teams quickly see:

  • Where most values cluster (approximate mean)
  • How wide the variation is (dispersion)
  • Whether the data is symmetric or skewed
  • Whether there are outliers
  • Whether the process has one peak (unimodal) or multiple peaks (bimodal/multimodal)

In Lean Six Sigma projects—especially in Measure and Analyze phases—histograms provide the first honest look at how a process is performing.

What Is a Histogram (in Simple Terms)?

A histogram is a bar chart that shows how frequently data points fall within defined ranges (called bins or classes). Each bar represents a range of values, and the height of the bar shows how many observations fall into that range.

Unlike a simple bar chart of categories, a histogram is used for continuous data such as:

  • Height
  • Weight
  • Diameter
  • Time
  • Cost
  • Cycle time
  • Response time

It is particularly useful to understand:

  • Approximate location of the mean
  • Spread/variation in data
  • Skewness (left or right)
  • Presence of outliers
  • Distribution type (normal, bimodal, multimodal)


Why Histograms Matter in Lean Six Sigma

In Lean Six Sigma, decisions must be data-driven. Histograms help teams move from assumptions to evidence. They are commonly used in:

  • Measure phase: to understand baseline performance
  • Analyze phase: to explore patterns and variation
  • Control phase: to monitor stability over time (in combination with control charts)

Histograms answer critical questions:

  • Is the process centered around the target?
  • Is variation too wide?
  • Are there hidden sub-populations?
  • Are there extreme values (outliers) that need investigation?

By visually displaying distribution, histograms reveal patterns that numeric summaries alone can hide.

Share:

Previous Post
Reduction of
Next Post
Histogram in

Leave a comment

Cancel reply

Recent Posts

  • Histogram in Six Sigma: A Practical Guide to Understanding Process Behavior and Data Distribution – Part 2
  • Histogram in Six Sigma: A Practical Guide to Understanding Process Behavior and Data Distribution – Part 1
  • Reduction of Thickness Variation in XLPE Foam Rolls
  • OTD Improvement in Last-Mile Grocery Deliveries
  • Improving Warehouse Space Utilization

Recent Comments

  1. Shawon on Dynamic website development to make money from online
Download Green Belt Curriculum

    Download Black Belt Curriculum

      Reserve My Seat

        Book a discovery call

          Book a discovery call

            Book a discovery call

              Book a discovery call

                Request a proposal

                  Request a proposal

                    Request a proposal

                      Request a proposal

                        Reserve my pathway

                          Reserve my pathway

                            Reserve my pathway

                              Reserve my pathway

                                Reserve My Seat

                                  Check My PMP Eligibility

                                    Talk To The Trainer

                                      Reserve My Seat

                                        Reserve My Free Seat

                                          Talk To The Advisor